Unlocking Collision Insights: Enhancing
Traffic Safety in New York City
7 min read

Unraveling Trends in Motor Vehicle Collisions: A Five-Year Study of NYC Crash Data (2018-2022)
The Motor Vehicle Collisions data contains the details of the crash event split by 5 boroughs of NYC. In the event of crash, the police department records the information by filling out a police report (MV104-AN) in the cases where someone is killed, injured or the damage is more than 1000$ worth. We have chosen a five-year window (2018-2022) to study the components, capturing the most recent trends, and leaving out the data for 2023 as it is an ongoing year and therefore, we don’t have the complete data.
Automobile accidents pose a serious threat to public health all over the world. Accidents involving motor vehicles can be attributed to a wide range of causes, such as human error, mechanical failure, poor infrastructure, and natural disasters. In 2016, road traffic injuries were responsible for an estimated 1.35 million deaths globally, as reported by the World Health Organization (WHO). In other words, on average, one person is killed every 26 seconds. Accident data analysis provides valuable information to law enforcement organizations, allowing them to better allocate resources and create more effective traffic enforcement and education initiatives. Additionally, insurance firms can more accurately price policies for motorists by studying data on auto accidents.
Injuries, fatalities, and economic losses due to road traffic accidents continue to be a global public health problem despite efforts to reduce them. New obstacles occur as advances in transportation infrastructure, vehicle engineering, and population dynamics provide fresh challenges. Vehicle accidents can be caused by a wide variety of variables, and in order to reduce their occurrence, it is essential to analyze these incidents. By combining data visualization with basic statistical analysis, our team will create a foundational model that can shed light on the problem, guide efforts to reduce the number of accidents, and even be used to help prepare machine learning algorithms. Using an Exploratory Data Analysis, we are trying to identify the key factors, timings, locations, vehicle types influencing the collisions and crashes.
Dissecting Urban Danger: A Deep Dive into NYC's Vehicle Collision Patterns, Causes, and Impact (2018-2022)
Fig.1- Number of Crashes in NYC by City and Year (2018-2022)
The number of crashes in each of the five boroughs of NYC. Brooklyn has the highest number of crashes, while Staten Island has the least. The number of crashes was higher in the years 2018 and 2019 for all boroughs and has declined in the later years.
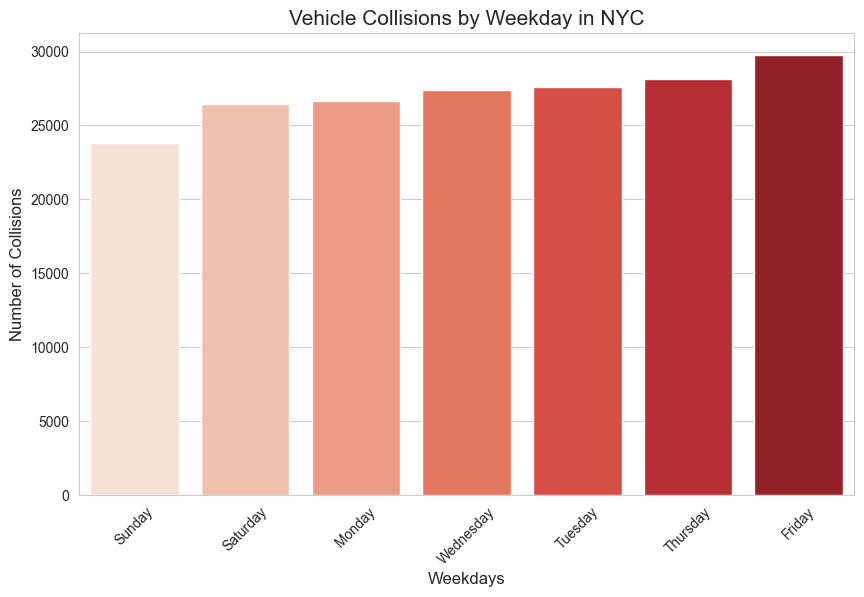
Fig.2- Vehicle Collisions by Weekday in NYC(2018-2022)
Here the number of vehicle collisions by weekdays in New York City from 2018 to 2022. It shows that collisions peak on Fridays and decrease on Sundays. This visualization helps to understand the pattern of collisions throughout the week and identify periods of increased risk.
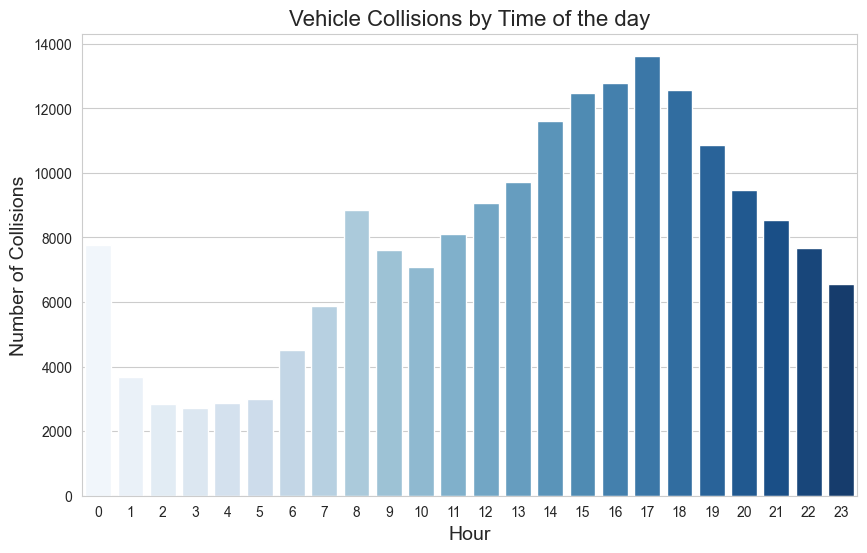
Fig.3_ Vehicle Collisions by Time of the day(2018-2022)
Here is the number of vehicle collisions by the time of day. It shows that the highest number of collisions occur during the afternoon, peaking around 5 pm, while the lowest number of collisions take place around 3 am. This visualization helps to understand the pattern of collisions throughout the day and identify periods of increased risk.
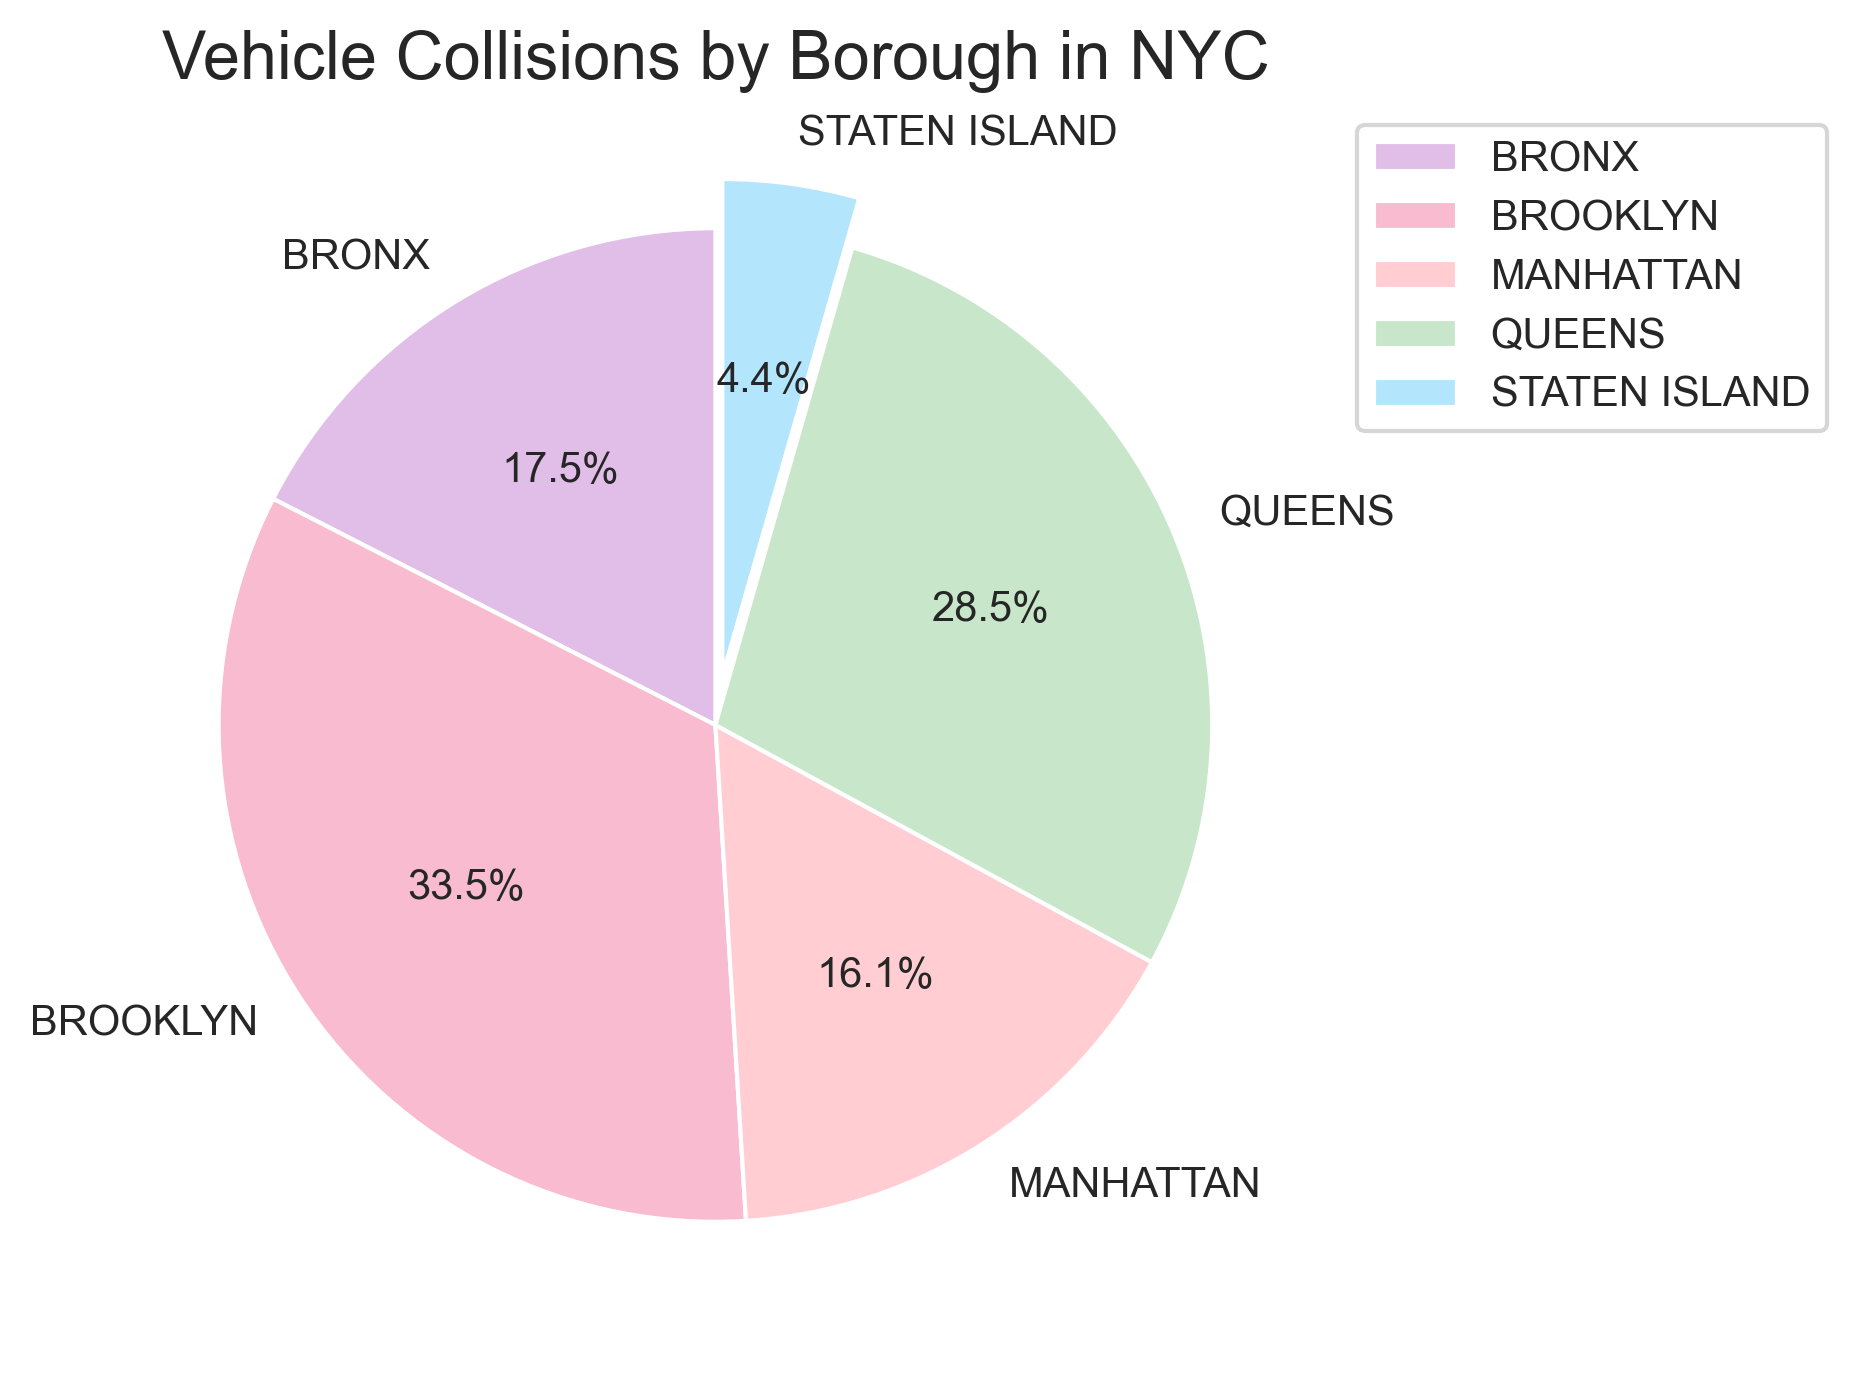
Fig.4- Vehicle Collisions by Borough in NYC(2018-2022)
Here is the proportion of vehicle collisions by borough in New York City. It shows that Staten Island has the lowest rate of collisions, accounting for only 4.4% of the total, while Brooklyn has the highest rate, accounting for 33.5% of the total collisions. This visualization helps to understand the distribution of vehicle collisions across different boroughs in New York City and can be useful for prioritizing safety measures and resource allocation to address the issue.
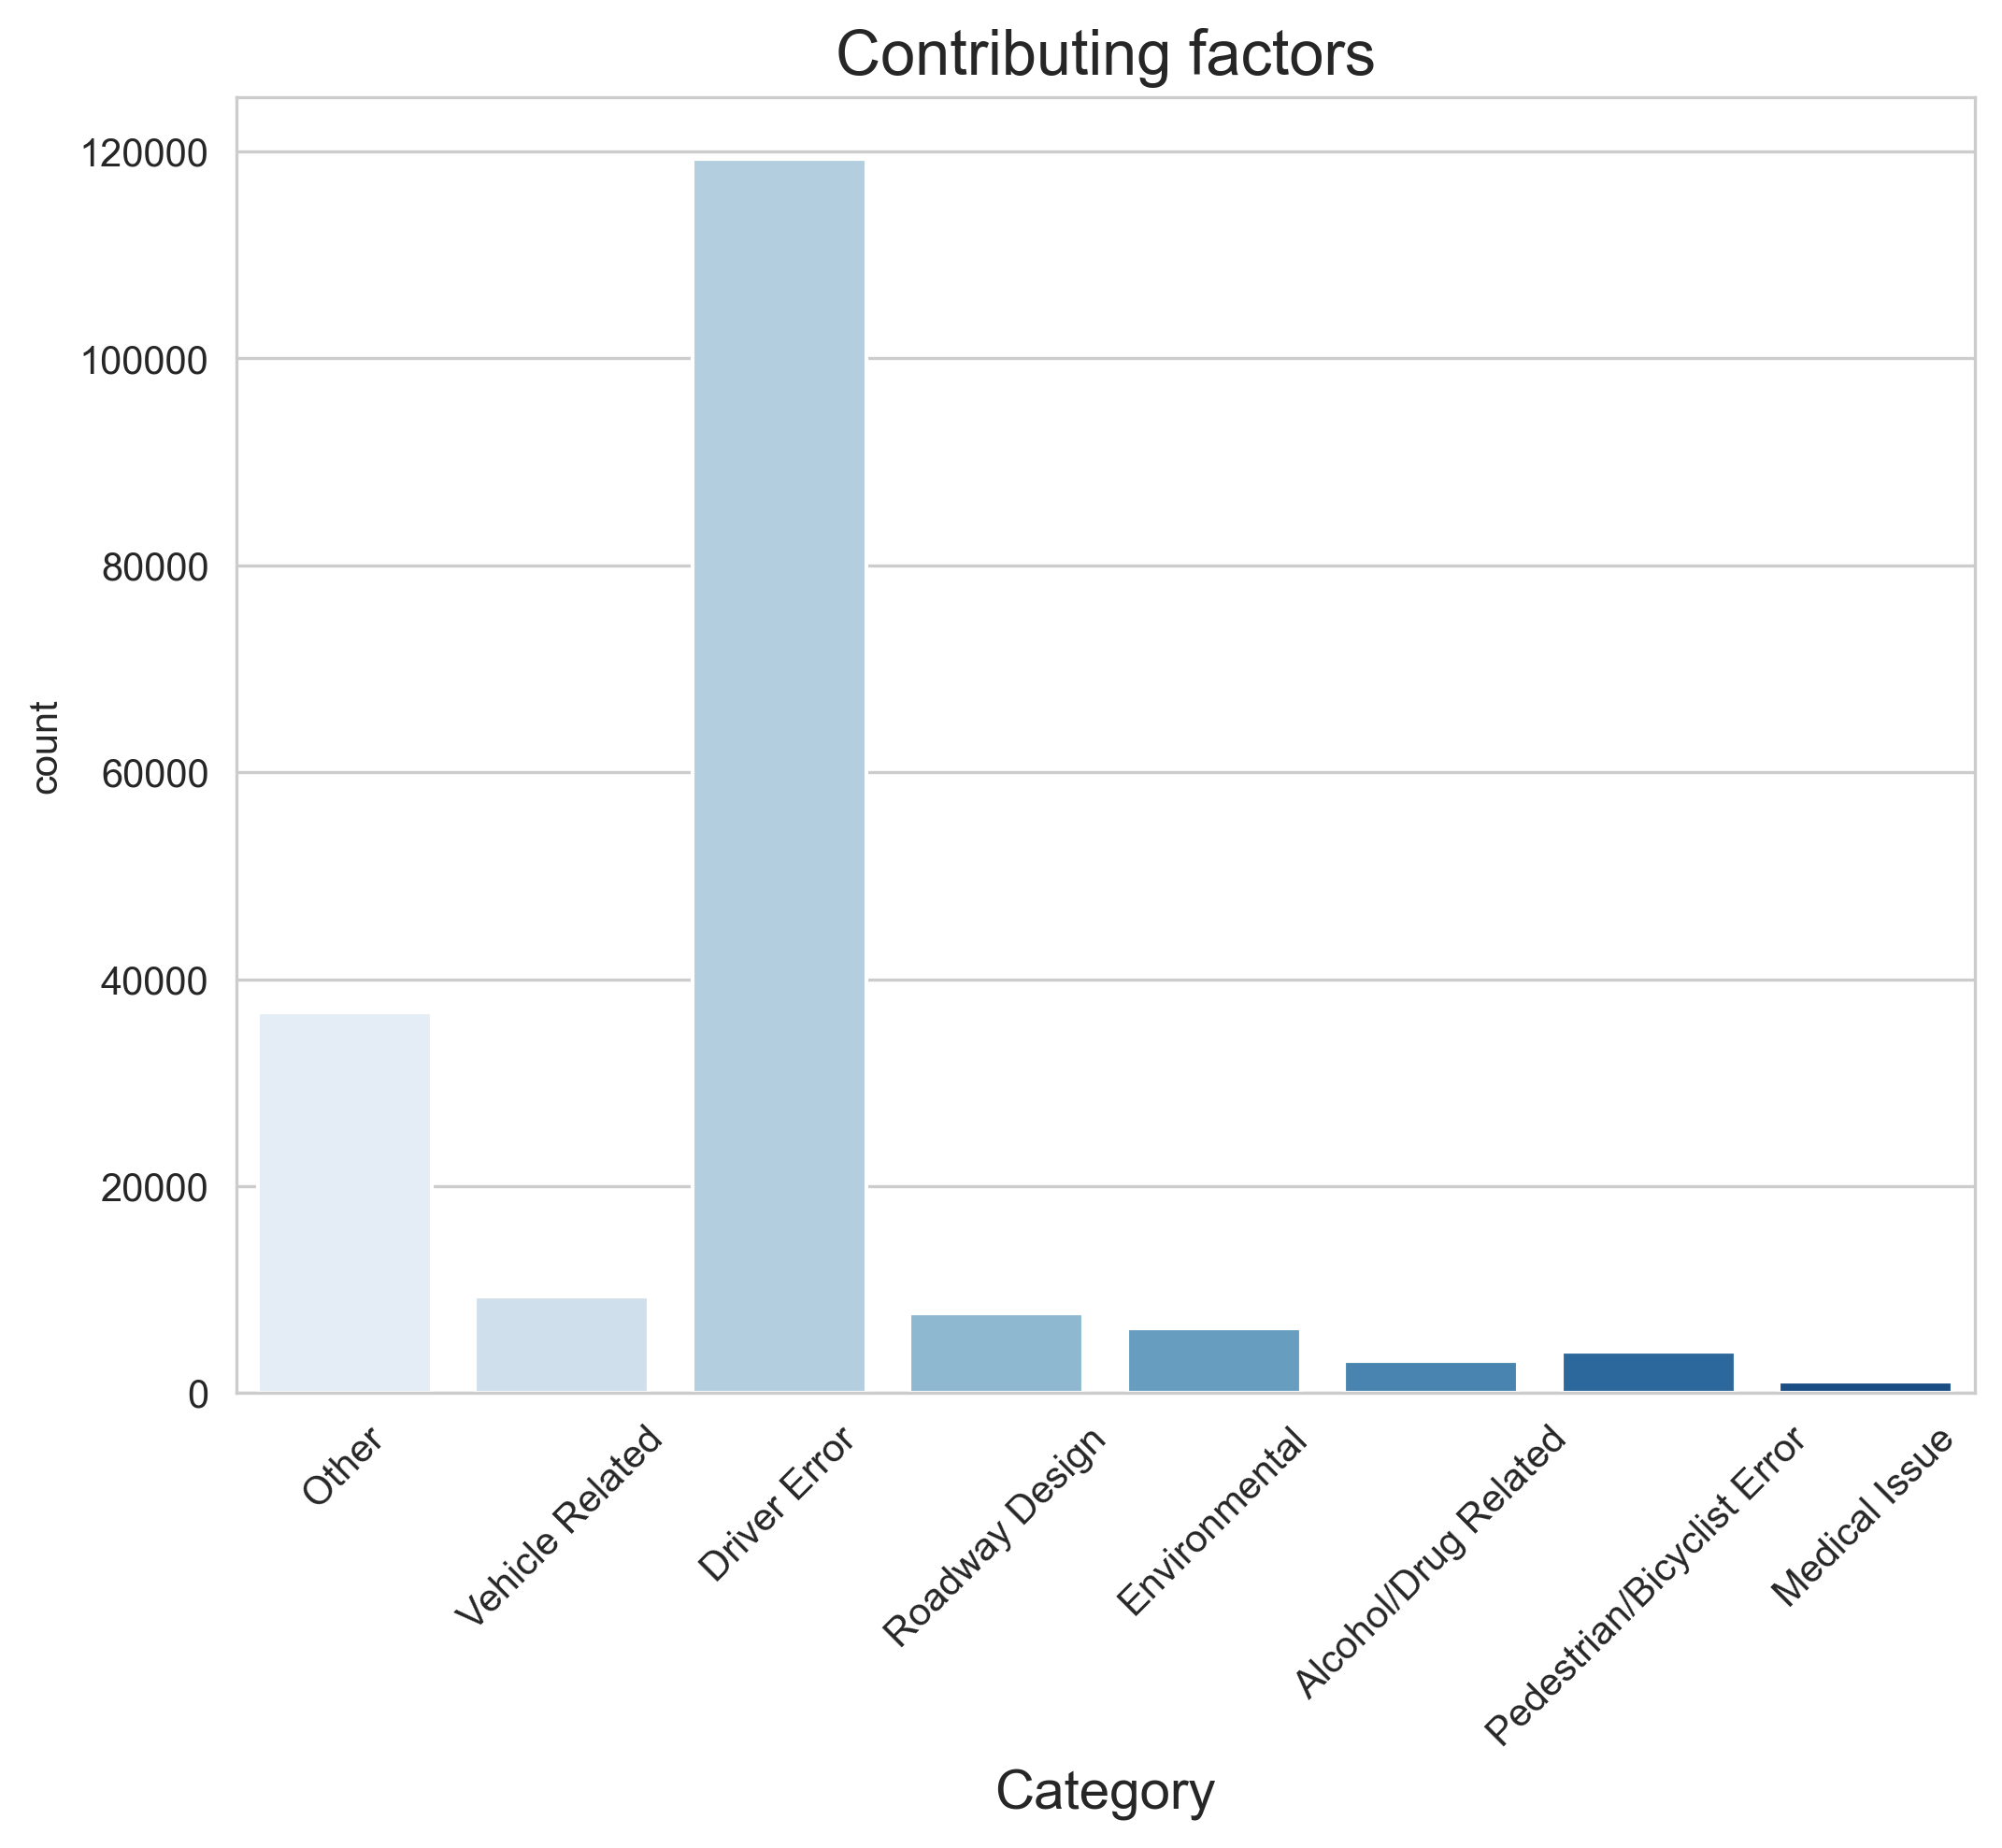
Fig.5- Contributing factors(2018-2022)
We are showing the number of collisions based on different contributing factors. It shows that the majority of collisions are caused by driver error, followed by other factors, with the least number of collisions due to medical issues. This visualization helps to understand the primary causes of vehicle collisions and can be useful for creating targeted interventions to reduce the risk of future accidents.
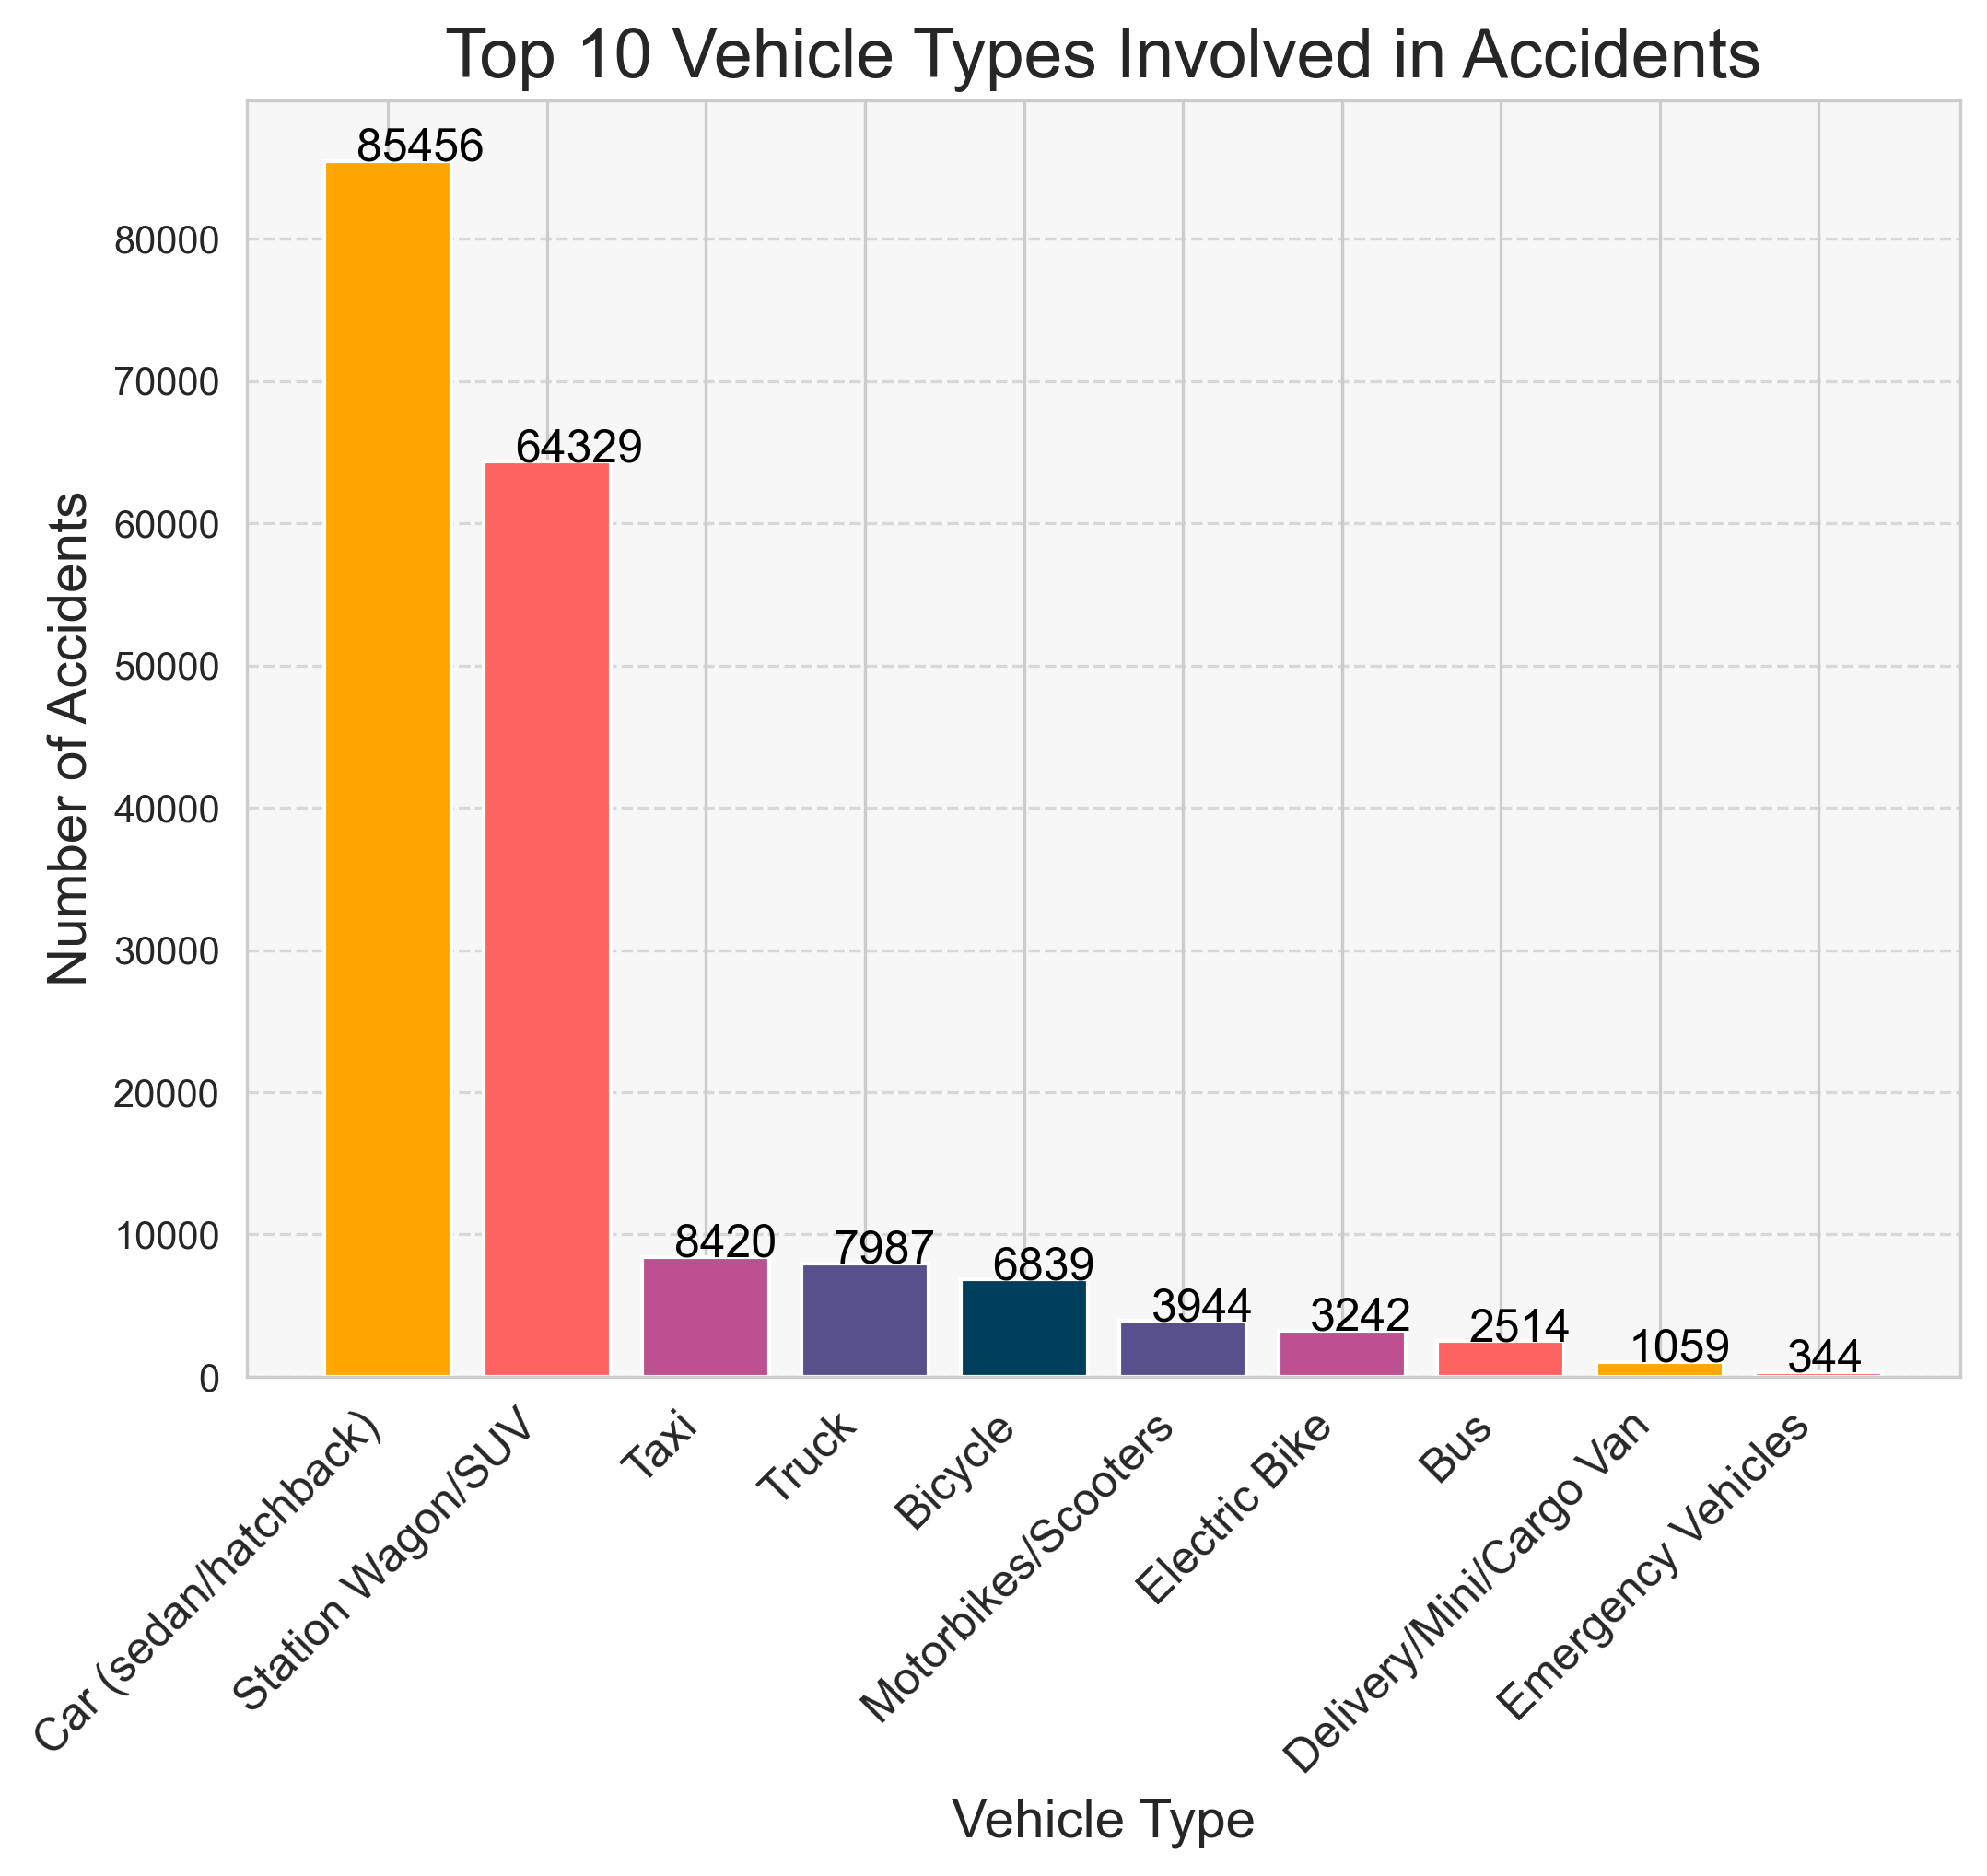
Fig.6- Top 10 Vehicle Types Involved in Accidents(2018-2022)
Here we see the top 10 vehicle types involved in accidents in New York City. It shows that cars (sedan/hatchback) have the highest number of collisions with 85.456, followed by station wagons/SUVs with 64.329, and emergency vehicles having the fewest collisions with 344. This visualization helps to understand which vehicle types are most commonly involved in accidents in New York City. This information can be useful for policymakers, insurance companies, and city planners to better understand the relationship between vehicle types and collisions and help inform targeted safety measures.
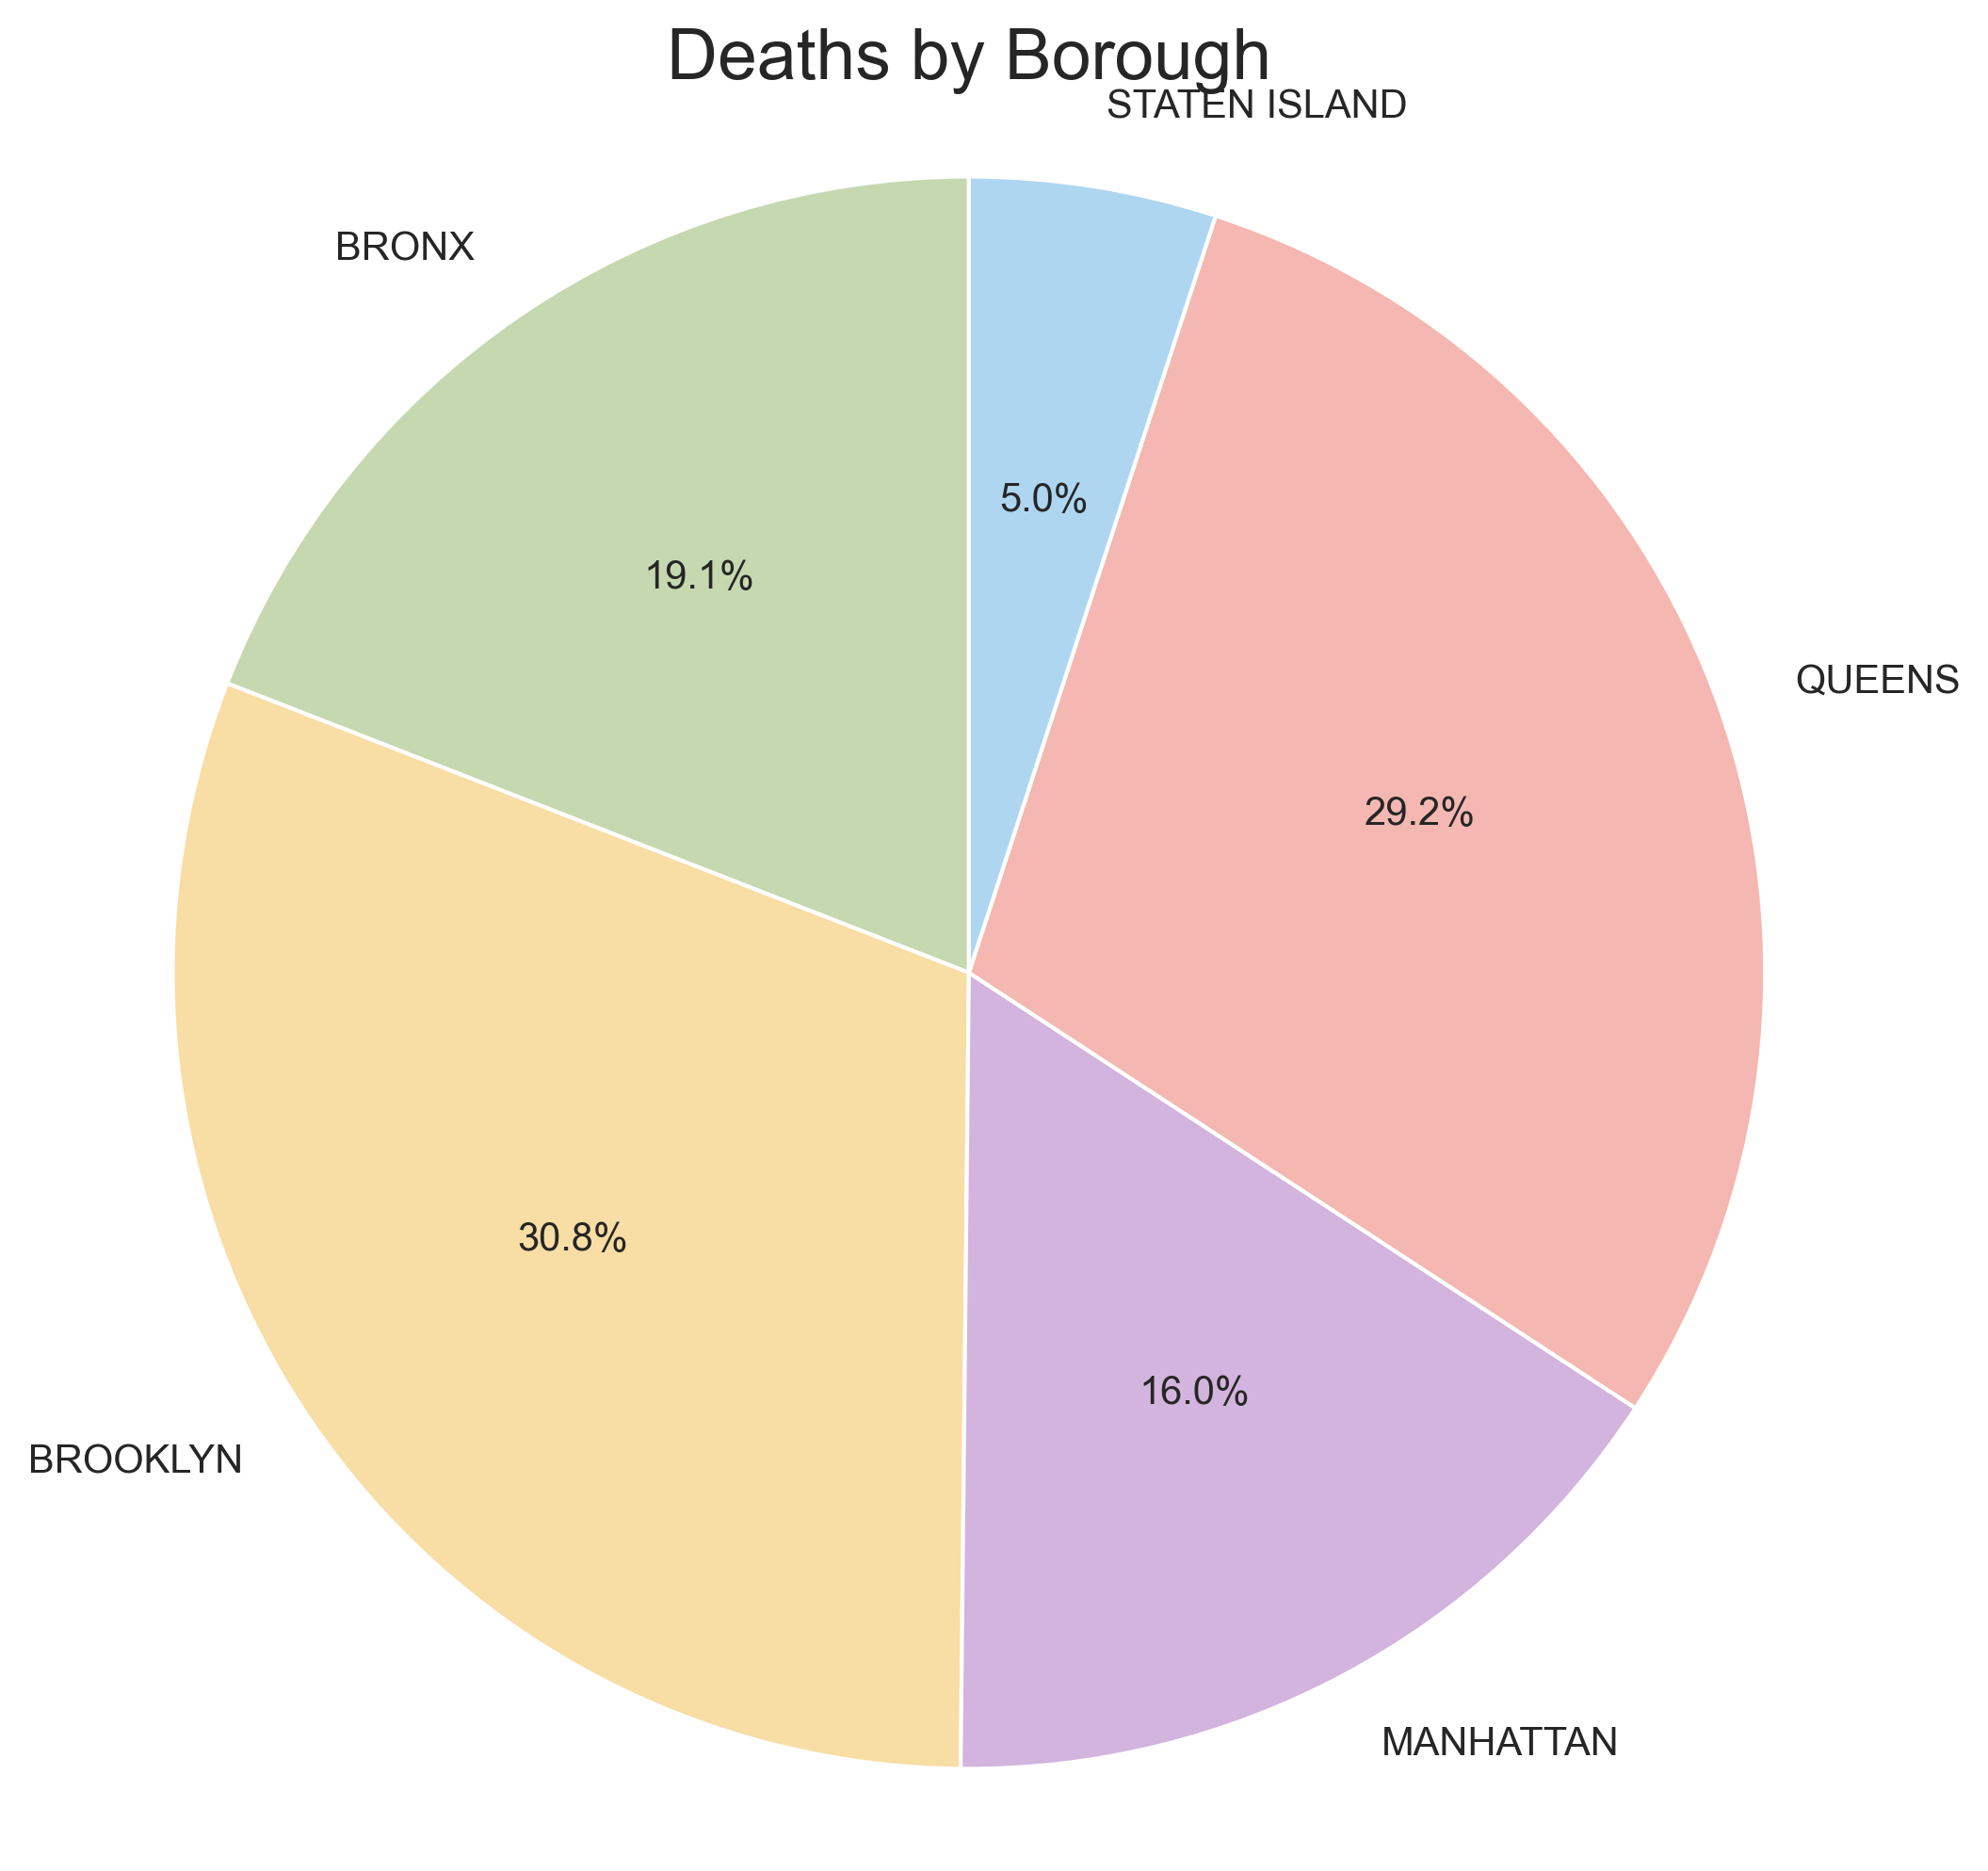
Fig.7- Injuries by Borough
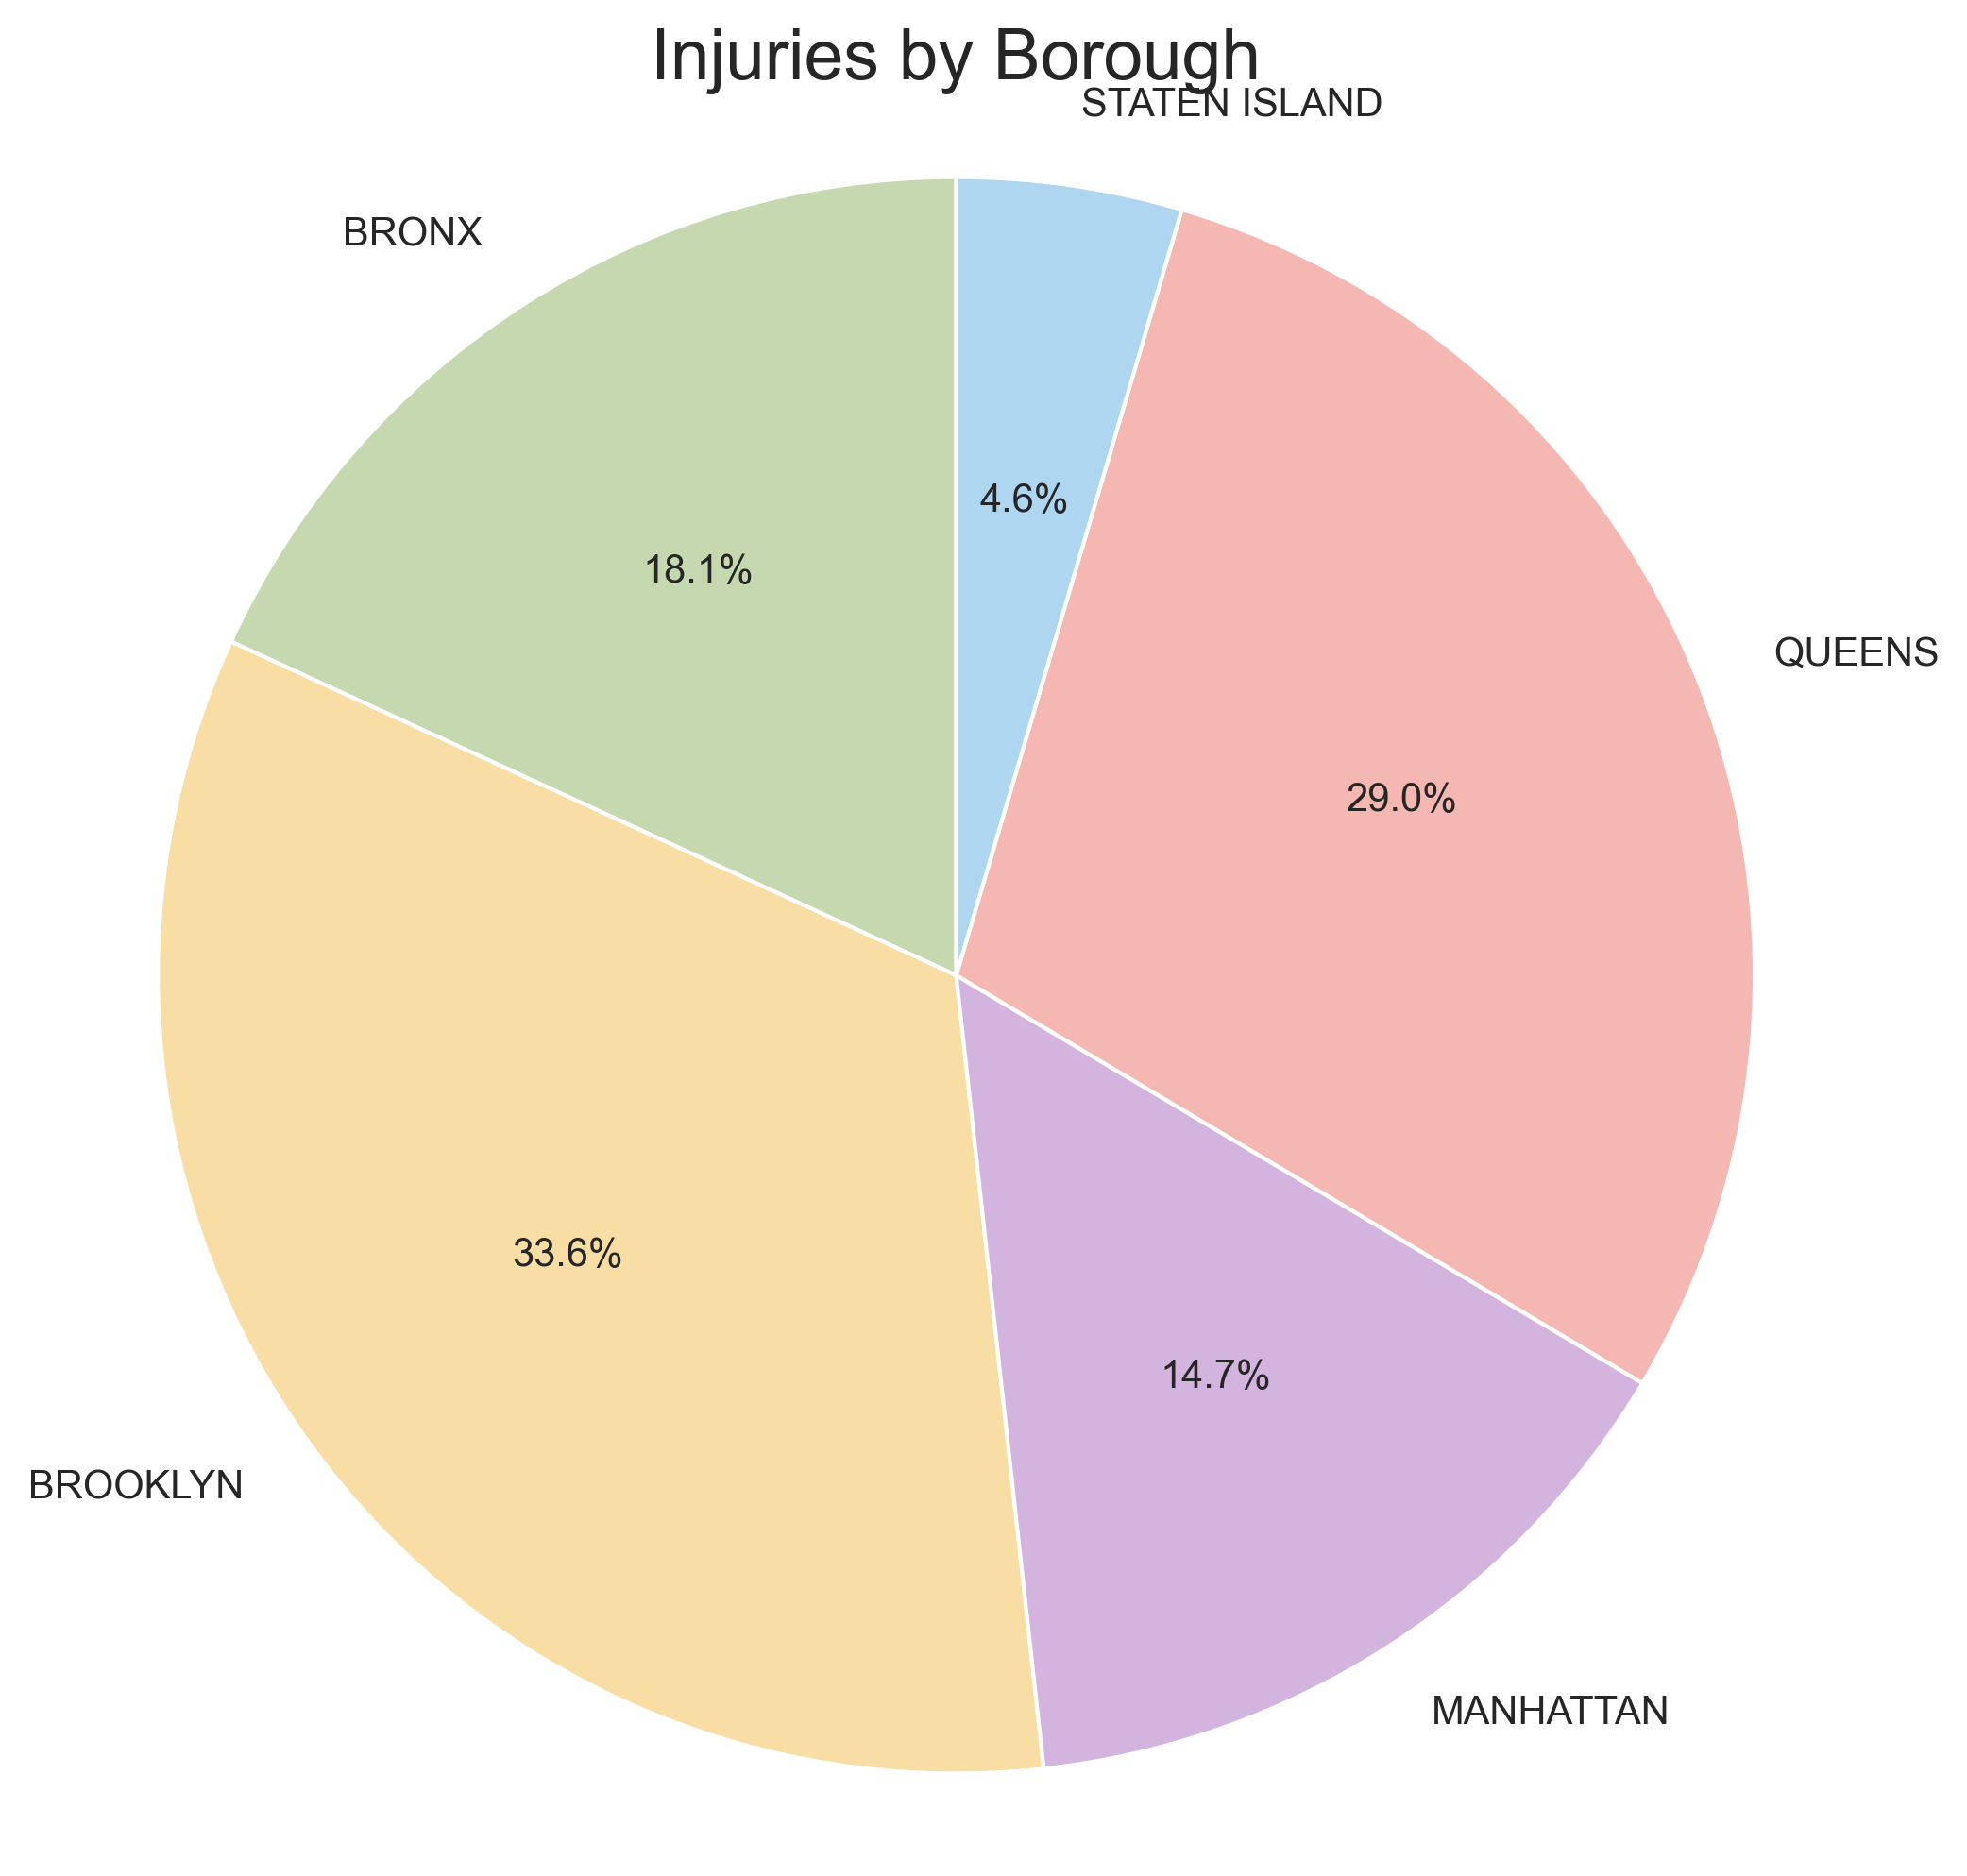
Fig.8- Deaths by Borough
These two plots displaying the distribution of injuries and deaths resulting from vehicle collisions across different boroughs in New York City. Both plots show that Brooklyn has the highest number of injuries (33.6%) and deaths (30.8%), while Staten Island has the lowest number of injuries (4.6%) and deaths (5.0%). These visualizations provide valuable insights into the distribution of injuries and deaths resulting from vehicle collisions in different boroughs of New York City. Policymakers, city planners, and healthcare providers can use this information to develop targeted interventions and allocate resources more effectively to reduce the impact of vehicle collisions on public health and safety.
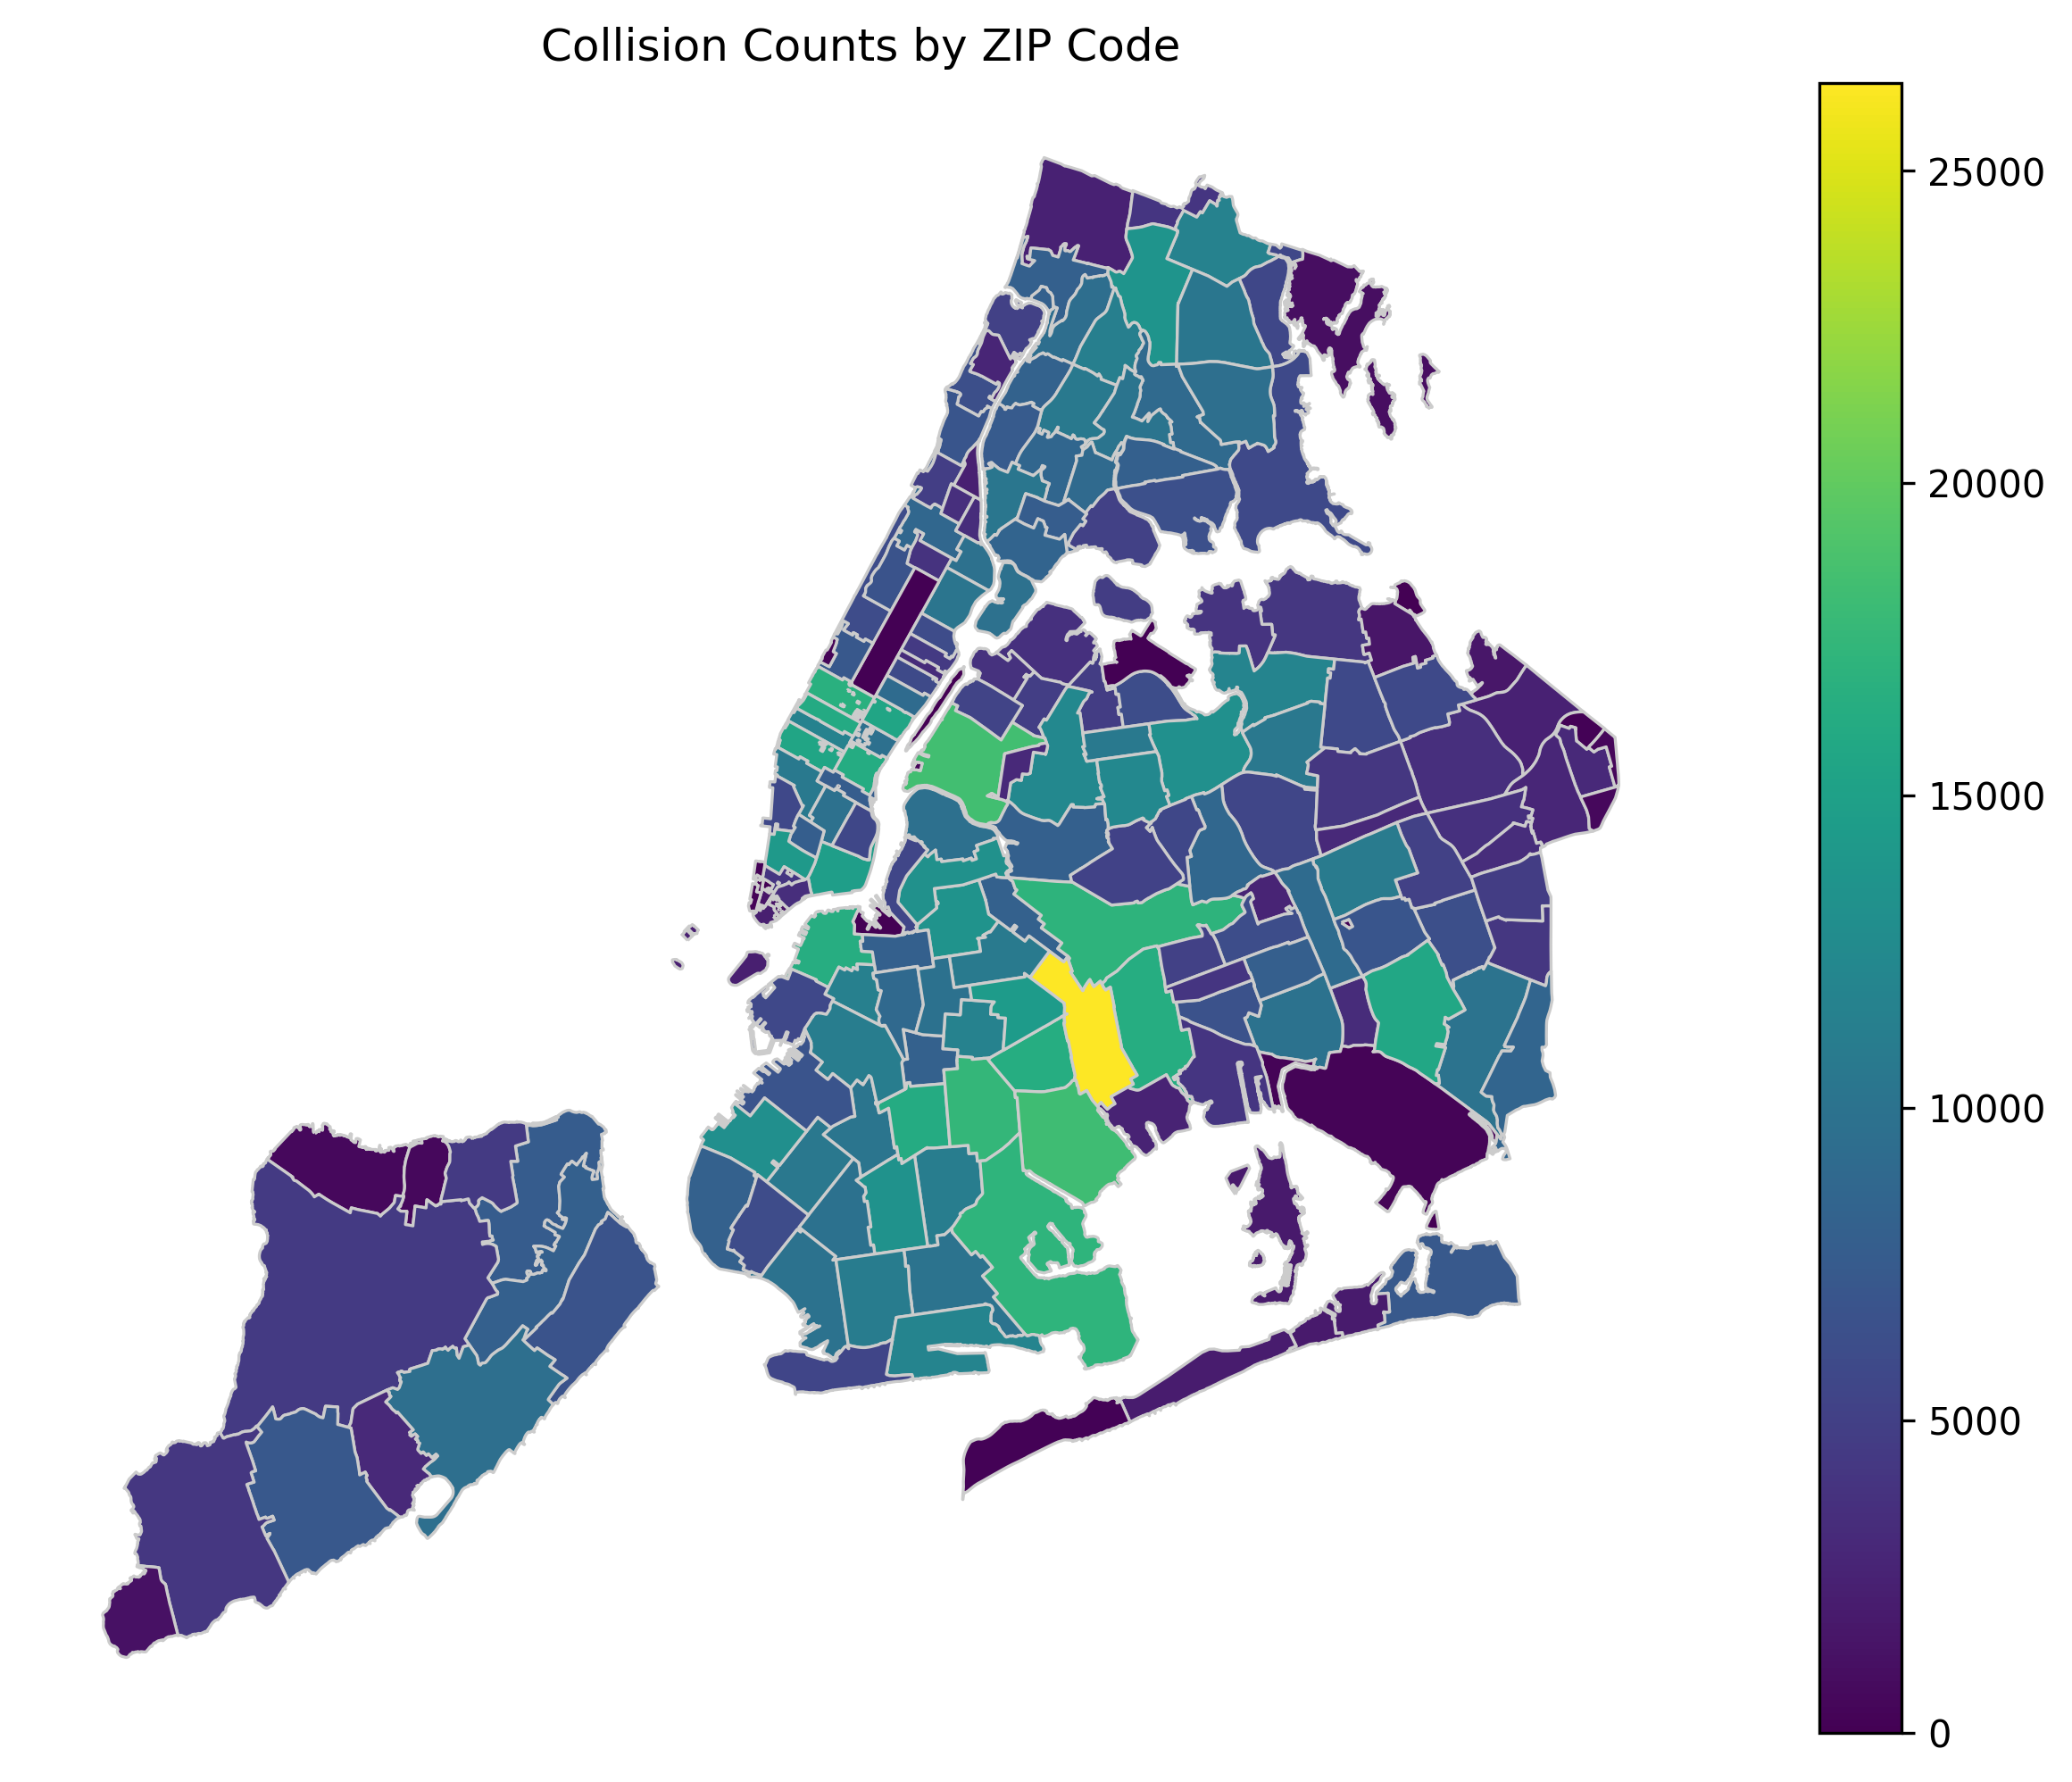
Fig.9- Collision Counts by ZIP Code
The choropleth map that displays motor vehicle collision counts in New York City, grouped by zip code. The color intensity represents the frequency of collisions in each area.
Insights and Implications from Visual Analytics
Accident rates in NYC remain relatively stable throughout the weekdays, but there is a noticeable increase on Fridays before declining again on Sundays. The most collisions in NYC occur at 5:00 PM, while the fewest happen at 3:00 AM. Collision rates start to rise gradually around 6:00 AM and peak at 8:00 AM during the morning rush hour. The highest number of collisions is observed during the late afternoon, and the rates gradually decrease as the day progresses towards the evening. Driver error is one of the major factors contributing to accidents, and our observations showed that the highest number of collisions occurred in Brooklyn. Cars, particularly sedans and hatchbacks, are the most common vehicles involved in collisions. In terms of injuries resulting from collisions, Brooklyn has the highest number (33.6%), followed by Queens (29%) and the Bronx (18.1%). This suggests that more focus should be placed on improving road safety measures in these areas. Brooklyn also has the highest number of deaths (30.8%) due to motor vehicle collisions. In contrast, Staten Island has the lowest number of deaths (5.0%).
Recommendations
- Enhance Safety Precautions: There is a significant need to augment road safety measures in areas like Brooklyn, Queens, and the Bronx to curtail the escalating numbers of injuries and fatalities resulting from motor vehicle accidents.
- Driver Awareness: Drivers, particularly those driving sedans, hatchbacks, and SUVs, need to be extra vigilant about blind spots to prevent accidents. Educational campaigns highlighting safe driving practices could be beneficial.
- Augment Law Enforcement: It would be beneficial to increase police presence during high-risk hours to discourage rash driving and ensure stricter enforcement of traffic rules. This could play a significant role in enhancing overall road safety.
- Employer Collaboration: Partnership with companies to instill safe commuting habits among employees could be instrumental in reducing accidents. Encouraging flexible working hours and promoting carpooling initiatives can decrease the number of vehicles on the road during accident-prone hours, thus mitigating the risk of collisions.